“I believe there have been three great pillars of investing success over the past 20+ years: US home country bias, US tech bias, and US dollar bias. I believe that all three of these are now melting icebergs, with enough mass to melt for a decade or more. That’s the backdrop for a Prisoners Dilemma portfolio, basically doing the reverse of what’s worked on autopilot for the past 20 years.”
Get your Free
financial review
There’s a scene towards the end of Oliver Stone’s 1986 Vietnam movie, ‘Platoon’. The North Vietnamese Army (NVA) has just launched a surprise attack on the US base. An NVA sapper laden with explosives has run into the battalion HQ and blown himself up – along with everybody inside. NVA troops are everywhere. In desperation, Captain Harris calls up an airstrike.
Harris: “Snakebite leader, Bravo Six, for the record, it’s my call. Dump everything you got left ON MY POS! I say again, I want all you’re holding INSIDE the perimeter. It’s a lovely war. Bravo Six Actual and Out.”
Harris realises that the situation is dire. The enemy is pouring through gaps in the wire in overwhelming numbers. Absent some kind of miracle, every single one of his troops is going to die. With an airstrike inside his own perimeter, at least some of them might survive.
An unconventional problem warrants an unconventional solution.
Welcome to the financial markets of 2025.
We have long held that the single biggest problem facing investors is the colossal debt burden accumulated by almost every western government: a problem that we now fear has morphed into an insoluble predicament. This, we suggest, is at the heart of economic policy as practised by Trump 2.0. Under the guise of (anti-China) tariffs, Donald Trump and Scott Bessent are trying to drive down the US dollar along with US Treasury yields. Unfortunately for Trump 2.0, the bond market is not playing along.
This may be because the very essence of modern economics is based on a false view of the world.
“We have involved ourselves in a colossal muddle,” wrote the British economist John Maynard Keynes in his essay ‘The Great Slump of 1930’;
“…having blundered in the control of a delicate machine, the working of which we do not understand. The result is that our possibilities of wealth may run to waste for a time – perhaps for a long time.”
Keynes was right about the slump in wealth. But the ‘economy as a machine’ metaphor is invalid. The great insight of the so-called Austrian economic school, inspired by the likes of Ludwig von Mises and Friedrich Hayek, is that the economy is far too complex to be compared to a simple mechanism. As the Austrians recognised, the economy is us. It is subject to all of the hopes, fears, frailties, emotions, and illogic of human beings.
Good luck modelling that. Not that it has stopped economists from trying.
Modern economics – call it Keynesianism, or neo-Keynesianism – is a bastard science. It is not really a science at all. When the Frenchman Léon Walras, who had serially failed at every job to which he had previously turned his hand, walked with his father one evening in 1858, he was advised by Walras Sr. to have a crack at “the creation of a scientific theory of economics”.
Walras Jr. had previously botched careers in academia, engineering, creative writing, journalism, and banking. That he had been rejected, twice, from France’s prestigious Ecole Polytechnique due to poor mathematical skills tells you everything you need to know about the birth of modern economics.
But Walras Jr. did not give up. Rather, he flunked again. Before Walras, economics had not even been a mathematical field. Eric Beinhocker in ‘The Origin of Wealth’ picks up the story:
“Walras and his compatriots were convinced that if the equations of differential calculus could capture the motions of planets and atoms in the universe, these same mathematical techniques could also capture the motion of human minds in the economy.”
In other words, Walras hijacked a bunch of principles from the realm of physics and then misapplied them to a grotesquely oversimplified model of his own economy. It’s true: economics was born out of physics envy.
Walras was not alone. Beinhocker points out that he was “not the only economist during his era raiding physics textbooks in search of inspiration”; the British economist William Stanley Jevons is also cited for ‘borrowing’ from the theories of gravity, magnetism and electricity in an attempt to turn economics into a mathematical science.
Let’s fast forward a little further, to 1952.
Harry Markowitz has just published an article – ‘Portfolio Selection’, Journal of Finance 7 (1) – which will go on to achieve cult status within financial circles.
Markowitz, a young mathematician with no experience of investment whatsoever, argued that a diversified portfolio is always preferable to an undiversified one. This is based on the presumption that ‘variance of return is an undesirable thing’ – and a mathematical proof that variance of return may be reduced within a portfolio of stocks and shares by holding a number of different shares.
But even by holding a large number of shares, it is not possible to eliminate variance of returns altogether. Nor is it possible for any one portfolio to exhibit both the maximum return and the minimum variance. Once an investor has achieved effective diversification, then:
“There is a rate at which the investor can gain expected return by taking on variance [reducing the number of shares he owns], or reduce variance by giving up expected return [by diversifying his portfolio again].”
Markowitz has not explicitly stated that risk and volatility (variance) are the same thing. But as a result of his article, the financial industry would go on to treat volatility and risk as synonymous, and the financial regulators would then join them in that erroneous belief.
Once again, the Austrians were on the preferred track. Another substantive insight from the Austrian school was that risk – whatever risk might even be – is entirely subjective. It is subject to context. Your risk and my risk are not the same.
But Markowitz assumed that risk is the same as volatility, therefore all risk is the same.
As did the legions of financial professionals who followed in his wake.
Risk is not, realistically, volatility – the extent to which a price wobbles around an average level. Risk is, for example, the likelihood that you incur a permanent capital loss. You saved for your retirement and lost everything? Now that is risk.
Older economists than Markowitz never even dared to define risk. Although there was keen discussion among economists, before World War One, as to what risk might be, and whether it was the same thing as uncertainty, there was complete agreement that whatever risk was, it was probably too complex a thing ever to be fully understood and, crucially, that it was incapable of mathematical calculation.
But Markowitz essentially put a figure on risk. Risk, post-Markowitz, equated to the annualised standard deviation of a portfolio’s return – in other words, how much its net asset value wobbled. Not the likelihood of complete financial failure for the portfolio’s owner, but merely the extent to which its net asset value oscillated around a mean.
There is a quotation attributed to the great physicist Albert Einstein:
“Not everything that can be counted counts, and not everything that counts can be counted.”
Volatility (the standard deviation of an investment, or an investment portfolio’s return), per Markowitz, can be counted. Risk, which truly counts, cannot be counted.
Peter L. Bernstein, in his magisterial biography of risk, ‘Against the Gods’, suggests that the sea change in attitude towards risk came about because of widespread revulsion at the horrific slaughter of the Second World War. The awful toll on human life bred an attitude that international cooperation could and should be organised so as to prevent any recurrence of that tragedy, and to try and improve the human condition in general. This attitude gave rise to new international organisations like the United Nations, the World Health Organisation, and the World Bank.
If science could give us the atom bomb, the thinking went, it could also define risk.
It just couldn’t identify it properly. Or deploy it within a model that might actually be of use to investors.
Markowitz’s lack of underlying market knowledge is a bit of a scandal. In Bernstein’s words:
“Markowitz had no interest in equity investment when he first turned his attention to the ideas [in his research note]. He knew nothing about the stock market. A self-styled ‘nerd’ as a student, he was working in what was then the relatively young field of linear programming.
One day, while waiting to see his professor to discuss a topic for his doctoral dissertation, Markowitz struck up a conversation with a stock broker sharing the waiting room who urged him to apply linear programming to the problems investors face in the stock market. Markowitz’s professor seconded the broker’s suggestion enthusiastically, though he himself knew so little about the stock market that he could not advise Markowitz on how or where to begin his project.”
To a man with a hammer, everything looks like a nail. To a mathematician with no market experience, why not assume that equations can solve everything?
Aldous Huxley, who came from a family of distinguished scientists, once wrote that science simply ignores anything which it cannot measure.
“Not everything that counts can be counted.”
Finance World cheerfully adopted the volatility of historic returns as an appropriate proxy for risk. Based upon this idea, the Capital Asset Pricing Model (CAPM) was developed. And then we got the Efficient Market Hypothesis. And value-at-risk…
The CAPM model, for example, is still alive and well and being taught to brand new generations of fund managers, and CFA candidates, despite the fact that it is garbage. The essence of CAPM is as follows:
r = Rf + Beta x (RM – Rf)
where
r is the expected return on a security;
Rf is the “risk-free” rate (i.e. cash);
Beta is the overall market risk;
RM is the return from the appropriate asset class.
We draw attention to the variable “Rf ”, or the ‘risk-free’ rate.
This already is an impossibility. There is no “risk-free” rate. Nothing is risk free, not even the air that you breathe.
It also raises a question as to whether the “beta” variable is an appropriate or accurate proxy for market risk. And whether it’s remotely sensible to boil down risk per se to an easily calculable figure.6
Just consider some of the incredible assumptions that are necessary in order for this mathematical model of financial risk to “work”:
- Investors are all identical
- Investors are all equally risk-averse, profit-maximising individuals
- All investors have access to all available information about the market simultaneously
- Market returns obey a model of ‘normal’ distribution, i.e. a bell curve.
- Asset markets are frictionless, information is costless, trading is costless, and the borrowing and lending rates are identical
- There are no such things as taxes, regulations or restrictions on short selling.
Stephen Hawking makes the following observation in ‘A Brief History of Time’:
“[a scientific theory] is always provisional in the sense that it is only a hypothesis: you can never prove it. No matter how many times the results of experiments agree with some theory you can never be sure that the next time the results will support the theory. On the other hand you can disprove a theory by finding even a single observation that disagrees with the predictions of the theory.”
Science is science, and finance isn’t. In Finance World, simplistic models are used in crude simulations of the market, and the only way their creators can even attempt to keep a straight face is by bolting on ever more elaborate fixtures to the models to account for their all-too-obvious flaws.
There’s a (not particularly funny) joke about economics that’s relevant here.
A physicist, a chemist and an economist are washed ashore on a desert island.
Pretty soon, their supplies are exhausted and they’re on the verge of death.
Then, out of nowhere, a can of baked beans rolls ashore. But how to open it?
The physicist thinks for a second.
“With the right materials I can probably assemble some kind of solar array to burn through the lid,” he says. “Let me think…”
The chemist mulls over the problem.7
“I can probably make some kind of chemical reaction involving salt water and that way we can erode the lid,” he says.
Now it’s the economist’s turn.
“Let us first assume we have a can-opener…”
Building on the work of Harry Markowitz, the CAPM was the creation of Jack Treynor, William Sharpe, John Lintner and Jan Mossin. Sharpe, Markowitz and Merton Miller would go on to receive the 1990 Nobel Memorial Prize in Economics – always a dangerous sign – for their “contribution” to financial economics. Fischer Black and Myron Scholes would go on to develop the so-called Black-Scholes model for derivative pricing in 1973.
Bad economics. Overly crude modelling. Widespread adoption within the financial services industry. What could possibly go wrong?
Prior to the financial crisis of 2007/8, the finest example of academic vanity leading to disaster came in the form of Long Term Capital Management (LTCM), the hedge fund demolished by its own Nobel laureates. It is said that during a fund raising round in late 1993, a young trader at the insurance company Conseco bridled at the idea that LTCM could reap massive rewards from the (highly efficient) multi-trillion dollar US Treasury bond market. Future Nobel laureate and co-inventor of Black-Scholes, Myron Scholes, immediately responded:
“You’re the reason. Because of fools like you we can.”
LTCM would go on to lose billions, back when that was an incredible sum of money. Their losses were so severe, in fact, they were deemed ‘too big to fail’ and required a massive bailout.
LTCM was the dress rehearsal for the global financial crisis in two respects. First, because it showed how much money you could lose with enough Nobel laureate economists on your side. Second, because it effectively enforced the principle of “the Greenspan put” – the idea that, in extremis, the Fed, or any other central bank, would a) slash interest rates to help out Wall Street and b) do whatever else it took to bail out Wall Street. Taxpayers be damned.
Nearly three decades later, the Greenspan / Bernanke / Yellen / Powell put is starting to look a little long in the tooth.8
We can trace the failure of LTCM in 1998 right back to Markowitz and, for that matter, to Walras himself.
The market volatility experienced in stock, bond and currency markets in August 1998, for example, should, according to Finance World’s standard risk models, never have occurred.
On August 4 of that year, the Dow Jones Industrial Average fell by 3.5%.
Three weeks later, as the news out of Russia got worse, stocks fell by 4.4%.
On August 31, they fell by 6.8%.
Other asset classes fared worse – notably bonds. Bank bonds fell by a third in value relative to Treasuries. LTCM was on the wrong side of both trades (it was long credit and short government debt, in all markets, using leverage of 200:1. The adjective “foolish” springs to mind.)
Standard risk modelling theory had estimated the odds of that final, August 31 collapse at one in 20 million – something that, if you traded daily for almost 100,000 years, you would not expect to encounter once.
The odds of experiencing three such declines in the same month were even more minute – roughly one in 500 billion.
In the parlance of risk modelling and the normal distribution curve of standard deviation (the bell curve), August 1998 was a succession of “fat tails”.
Or was it?
A year beforehand, the Dow had fallen by 7.7% in a single day. Probability: one in 50 billion.
In July 2002, the Dow recorded three separate steep falls within seven trading sessions. Probability: one in four trillion.
On October 19, 1987, the Dow fell by 29.2%. Based on the standard financial theory, the probability of the October 1987 crash was less than one in 1050 – odds so small that they have no meaning whatsoever in reality.
The bell curve, shown below, and courtesy of the German mathematician Carl Friedrich Gauss – hence the phrase ‘Gaussian distribution’ – shows variation in probability distributions.
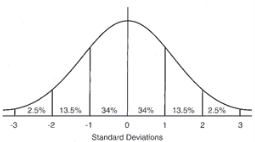
To make those somewhat arid numbers more relevant… Consider the adult male population in the USA. The average height of an American male adult is roughly 70 inches. The standard deviation from average height is two inches.
So 68% of all American men are between 68 and 72 inches tall (that is, they stand within one standard deviation either side of the mean).
95% of all American men are between 66 and 74 inches tall (within two standard deviations either side of the mean).
And so on.
The standard bell curve doesn’t “disprove” the existence of giants or dwarves – rather, it simply suggests that their populations are going to be very small. Which, in real life, is precisely the case.
But in the financial markets, the standard bell curve does not exist.
The bell curve is not a good map for those navigating financial market reality.
Between 1916 and 2003, for example, the daily index price movements of the Dow do not fit neatly on the bell curve. The ‘tails’ are too fat, i.e. the ends of the curve that are supposed to be very low probability events (like a 1 in 50 billion chance market crash) aren’t so low probability after all.
Based on the bell curve, there should have been 58 days when the Dow moved more than 3.4%. In fact, there were 1,001 of those events.
The bell curve predicts six days of index swings beyond 4.5%. In fact there were 366 of them.
Index price swings of more than 7% should, according to theory, come once every 300,000 years. In reality, the twentieth century saw 48 separate occasions of them.
Could standard financial theory be wrong?
Markowitz didn’t deserve his Nobel Memorial Prize in Economic Sciences. That award should have gone instead to the Polish-born scientist and mathematician Benoit Mandelbrot. But Mandelbrot died in 2010, so will sadly never get his chance.
Mandelbrot, father of the Mandelbrot set, of never-ending fractals, is co-author, alongside Richard Hudson, of a book entitled ‘The (mis)behaviour of markets’. This is, we would suggest, the perfect companion piece to Benjamin Graham’s ‘The Intelligent Investor’. Where Ben Graham addresses the art of investing, Mandelbrot addresses the science.
And Mandelbrot’s book is, to the best-selling author and financial theorist Nassim Nicholas Taleb: “The deepest and most realistic finance book ever published.”
If you happen to look at price records, as Mandelbrot did, especially in relation to the market in cotton, you find a different kind of distribution to that of the bell curve.
The tails in the market price curve do not flatten out into irrelevance. Rather, they follow a “power law” that happens to be quite common in nature.
In a “power law” relationship, a relative change in one quantity triggers a proportional relative change in another. If you double the length of a square, for example, its total area is multiplied not by two times, but by four.
The same type of “power law” holds for income distributions (the so-called Pareto principle, “the 80-20 rule”, shows that roughly 20% of the population accounts for 80% of its wealth). And it also holds, somewhat ominously for those who believe in stable or easily controllable markets, for earthquakes, volcanic eruptions, landslides, and forest fires.
Unlike Markowitz, who conjured up a square theory in blissful isolation and then hammered it into the round hole of the market, with little bits of relevance flying off the theory each time, Mandelbrot developed his own theories having already spent a good deal of time assessing historical prices.DECEMBER 2015 ISSUE F
Here are some of his conclusions.
Rule 1: Markets are riskier than we think. And certainly riskier than conventional financial theory thinks.
Price movements do not happily track the bell curve.
Extreme price swings are not the exception. They are the norm.
Which is one reason why ‘value’ investing carries extra appeal for us in today’s market environment. If we believe that market valuations have been badly distorted by monetary stimulus, it makes even more sense to concentrate on finding explicit “margins of safety”.
Rule 2: Trouble runs in streaks.
Or as Shakespeare put it: “When sorrows come, they come not single spies / But in battalions!”
Market turbulence does not arise out of a clear blue sky and then disappear. It tends to cluster. A wild market open may well be followed by an equally desperate full trading session. A wild Monday may well be followed by an even wilder Tuesday.
Rule 3: Markets have their own personality.
Ben Graham famously created the manic depressive character ‘Mr Market’ to account for the stock market’s oscillations between greed and fear.
But when individual investors, institutional fund managers, hedge funds, day traders and sovereign wealth funds come together in a real marketplace, a new kind of market personality emerges – both greater than, and different from, the sum of its constituent parts.
Mandelbrot suggests that market prices are determined by endogenous effects specific to the inner workings of those markets, rather than by exogenous, external events. For example, his analysis of cotton prices during the last century showed the same broad pattern of price variability when prices were unregulated as they did in the 1930s when cotton prices were regulated as part of FDR’s New Deal.
Rule 4: Markets mislead.
In Mandelbrot’s words: “Patterns are the fool’s gold of financial markets.”
The workings of random chance create patterns, and human beings are pattern recognition experts. We see patterns even where none exist.
This does not necessarily invalidate technical analysis – if enough market technicians believe that a certain price level equates to support, or resistance, that presumed support or resistance line will become a self-fulfilling prophecy. But Mandelbrot clearly advocates caution: financial markets are especially prone to statistical mirages. And bubbles and crashes are inherent to financial markets. “They are the inevitable consequence of the human need to find patterns in the patternless.”
Rule 5: Market time is relative.
Just as the market has its own personality, so it has its own time signature. Professional traders often speak of a “fast” market or a “slow” one, depending on their assessment of volatility at the time in question. And financial markets scale. Even the financial media scales: companies and media corporations issue annual reviews, quarterly results, monthly updates, daily newspapers and ad hoc electronic bulletins.
And in a “fast” market, things like market-, stop- or limit orders have limited utility. Prices don’t necessarily glide. Sometimes they gap down or leap up, effortlessly vaulting beyond price limits presumed to protect portfolios from ruin.
Without continued intervention by the world’s central banks, a deflationary crash may be inevitable. So how long will this intervention continue? We don’t know. And unless you’re a personal confidant of Jay Powell or Christine Lagarde, neither do you.
But there are practical steps we can all take to try to protect, preserve and grow our wealth.
We happen to believe that central banks, as Mario Draghi pledged back in July 2012, will continue to do “whatever it takes” to keep the financial system from the cliff ’s edge. Whether they succeed is another question. It might well be the case that in trying so hard to save the system, they end up accidentally destroying it. You cannot seriously study either economics or finance without becoming intimately familiar with the laws of unintended consequences.
We also happen to believe that there are realistically two, and only two, sustainable ways of creating and then exploiting “an edge” in the financial markets in pursuit of profit over the longer run. One is through price momentum (those trend-followers, again, who are just as happy to sell as they are to buy, provided the prevailing price trend is strong enough), and the other is throughIcompelling value – shares in high quality businesses with principled management and robust moats, but bought at a bargain price.
But properly compelling values in a world where central banks hold sway are increasingly difficult to come by. ‘Value’ is subjective, and contextual, and sits rather uneasily with the sort of monetary stimulus being ladled onto the markets. Ben Graham-style value opportunities sadly don’t grow on trees.
Right now, we see defensible value, and safe haven attributes, in precious metals and precious metals mining companies, complemented by systematic trend-following funds. But 60 /40 when both the 60 and the 40 aren’t working ? Desperate times call, at a minimum, for unorthodox investing.
………….
As you may know, we also manage bespoke investment portfolios for private clients internationally. We would be delighted to help you too. Because of the current heightened market volatility we are offering a completely free financial review, with no strings attached, to see if our value-oriented approach might benefit your portfolio – with no obligation at all:
Get your Free
financial review
…………
Tim Price is co-manager of the VT Price Value Portfolio and author of ‘Investing through the Looking Glass: a rational guide to irrational financial markets’. You can access a full archive of these weekly investment commentaries here. You can listen to our regular ‘State of the Markets’ podcasts, with Paul Rodriguez of ThinkTrading.com, here. Email us: info@pricevaluepartners.com.
Price Value Partners manage investment portfolios for private clients. We also manage the VT Price Value Portfolio, an unconstrained global fund investing in Benjamin Graham-style value stocks and also in systematic trend-following funds.
“I believe there have been three great pillars of investing success over the past 20+ years: US home country bias, US tech bias, and US dollar bias. I believe that all three of these are now melting icebergs, with enough mass to melt for a decade or more. That’s the backdrop for a Prisoners Dilemma portfolio, basically doing the reverse of what’s worked on autopilot for the past 20 years.”
Get your Free
financial review
There’s a scene towards the end of Oliver Stone’s 1986 Vietnam movie, ‘Platoon’. The North Vietnamese Army (NVA) has just launched a surprise attack on the US base. An NVA sapper laden with explosives has run into the battalion HQ and blown himself up – along with everybody inside. NVA troops are everywhere. In desperation, Captain Harris calls up an airstrike.
Harris: “Snakebite leader, Bravo Six, for the record, it’s my call. Dump everything you got left ON MY POS! I say again, I want all you’re holding INSIDE the perimeter. It’s a lovely war. Bravo Six Actual and Out.”
Harris realises that the situation is dire. The enemy is pouring through gaps in the wire in overwhelming numbers. Absent some kind of miracle, every single one of his troops is going to die. With an airstrike inside his own perimeter, at least some of them might survive.
An unconventional problem warrants an unconventional solution.
Welcome to the financial markets of 2025.
We have long held that the single biggest problem facing investors is the colossal debt burden accumulated by almost every western government: a problem that we now fear has morphed into an insoluble predicament. This, we suggest, is at the heart of economic policy as practised by Trump 2.0. Under the guise of (anti-China) tariffs, Donald Trump and Scott Bessent are trying to drive down the US dollar along with US Treasury yields. Unfortunately for Trump 2.0, the bond market is not playing along.
This may be because the very essence of modern economics is based on a false view of the world.
“We have involved ourselves in a colossal muddle,” wrote the British economist John Maynard Keynes in his essay ‘The Great Slump of 1930’;
“…having blundered in the control of a delicate machine, the working of which we do not understand. The result is that our possibilities of wealth may run to waste for a time – perhaps for a long time.”
Keynes was right about the slump in wealth. But the ‘economy as a machine’ metaphor is invalid. The great insight of the so-called Austrian economic school, inspired by the likes of Ludwig von Mises and Friedrich Hayek, is that the economy is far too complex to be compared to a simple mechanism. As the Austrians recognised, the economy is us. It is subject to all of the hopes, fears, frailties, emotions, and illogic of human beings.
Good luck modelling that. Not that it has stopped economists from trying.
Modern economics – call it Keynesianism, or neo-Keynesianism – is a bastard science. It is not really a science at all. When the Frenchman Léon Walras, who had serially failed at every job to which he had previously turned his hand, walked with his father one evening in 1858, he was advised by Walras Sr. to have a crack at “the creation of a scientific theory of economics”.
Walras Jr. had previously botched careers in academia, engineering, creative writing, journalism, and banking. That he had been rejected, twice, from France’s prestigious Ecole Polytechnique due to poor mathematical skills tells you everything you need to know about the birth of modern economics.
But Walras Jr. did not give up. Rather, he flunked again. Before Walras, economics had not even been a mathematical field. Eric Beinhocker in ‘The Origin of Wealth’ picks up the story:
“Walras and his compatriots were convinced that if the equations of differential calculus could capture the motions of planets and atoms in the universe, these same mathematical techniques could also capture the motion of human minds in the economy.”
In other words, Walras hijacked a bunch of principles from the realm of physics and then misapplied them to a grotesquely oversimplified model of his own economy. It’s true: economics was born out of physics envy.
Walras was not alone. Beinhocker points out that he was “not the only economist during his era raiding physics textbooks in search of inspiration”; the British economist William Stanley Jevons is also cited for ‘borrowing’ from the theories of gravity, magnetism and electricity in an attempt to turn economics into a mathematical science.
Let’s fast forward a little further, to 1952.
Harry Markowitz has just published an article – ‘Portfolio Selection’, Journal of Finance 7 (1) – which will go on to achieve cult status within financial circles.
Markowitz, a young mathematician with no experience of investment whatsoever, argued that a diversified portfolio is always preferable to an undiversified one. This is based on the presumption that ‘variance of return is an undesirable thing’ – and a mathematical proof that variance of return may be reduced within a portfolio of stocks and shares by holding a number of different shares.
But even by holding a large number of shares, it is not possible to eliminate variance of returns altogether. Nor is it possible for any one portfolio to exhibit both the maximum return and the minimum variance. Once an investor has achieved effective diversification, then:
“There is a rate at which the investor can gain expected return by taking on variance [reducing the number of shares he owns], or reduce variance by giving up expected return [by diversifying his portfolio again].”
Markowitz has not explicitly stated that risk and volatility (variance) are the same thing. But as a result of his article, the financial industry would go on to treat volatility and risk as synonymous, and the financial regulators would then join them in that erroneous belief.
Once again, the Austrians were on the preferred track. Another substantive insight from the Austrian school was that risk – whatever risk might even be – is entirely subjective. It is subject to context. Your risk and my risk are not the same.
But Markowitz assumed that risk is the same as volatility, therefore all risk is the same.
As did the legions of financial professionals who followed in his wake.
Risk is not, realistically, volatility – the extent to which a price wobbles around an average level. Risk is, for example, the likelihood that you incur a permanent capital loss. You saved for your retirement and lost everything? Now that is risk.
Older economists than Markowitz never even dared to define risk. Although there was keen discussion among economists, before World War One, as to what risk might be, and whether it was the same thing as uncertainty, there was complete agreement that whatever risk was, it was probably too complex a thing ever to be fully understood and, crucially, that it was incapable of mathematical calculation.
But Markowitz essentially put a figure on risk. Risk, post-Markowitz, equated to the annualised standard deviation of a portfolio’s return – in other words, how much its net asset value wobbled. Not the likelihood of complete financial failure for the portfolio’s owner, but merely the extent to which its net asset value oscillated around a mean.
There is a quotation attributed to the great physicist Albert Einstein:
“Not everything that can be counted counts, and not everything that counts can be counted.”
Volatility (the standard deviation of an investment, or an investment portfolio’s return), per Markowitz, can be counted. Risk, which truly counts, cannot be counted.
Peter L. Bernstein, in his magisterial biography of risk, ‘Against the Gods’, suggests that the sea change in attitude towards risk came about because of widespread revulsion at the horrific slaughter of the Second World War. The awful toll on human life bred an attitude that international cooperation could and should be organised so as to prevent any recurrence of that tragedy, and to try and improve the human condition in general. This attitude gave rise to new international organisations like the United Nations, the World Health Organisation, and the World Bank.
If science could give us the atom bomb, the thinking went, it could also define risk.
It just couldn’t identify it properly. Or deploy it within a model that might actually be of use to investors.
Markowitz’s lack of underlying market knowledge is a bit of a scandal. In Bernstein’s words:
“Markowitz had no interest in equity investment when he first turned his attention to the ideas [in his research note]. He knew nothing about the stock market. A self-styled ‘nerd’ as a student, he was working in what was then the relatively young field of linear programming.
One day, while waiting to see his professor to discuss a topic for his doctoral dissertation, Markowitz struck up a conversation with a stock broker sharing the waiting room who urged him to apply linear programming to the problems investors face in the stock market. Markowitz’s professor seconded the broker’s suggestion enthusiastically, though he himself knew so little about the stock market that he could not advise Markowitz on how or where to begin his project.”
To a man with a hammer, everything looks like a nail. To a mathematician with no market experience, why not assume that equations can solve everything?
Aldous Huxley, who came from a family of distinguished scientists, once wrote that science simply ignores anything which it cannot measure.
“Not everything that counts can be counted.”
Finance World cheerfully adopted the volatility of historic returns as an appropriate proxy for risk. Based upon this idea, the Capital Asset Pricing Model (CAPM) was developed. And then we got the Efficient Market Hypothesis. And value-at-risk…
The CAPM model, for example, is still alive and well and being taught to brand new generations of fund managers, and CFA candidates, despite the fact that it is garbage. The essence of CAPM is as follows:
r = Rf + Beta x (RM – Rf)
where
r is the expected return on a security;
Rf is the “risk-free” rate (i.e. cash);
Beta is the overall market risk;
RM is the return from the appropriate asset class.
We draw attention to the variable “Rf ”, or the ‘risk-free’ rate.
This already is an impossibility. There is no “risk-free” rate. Nothing is risk free, not even the air that you breathe.
It also raises a question as to whether the “beta” variable is an appropriate or accurate proxy for market risk. And whether it’s remotely sensible to boil down risk per se to an easily calculable figure.6
Just consider some of the incredible assumptions that are necessary in order for this mathematical model of financial risk to “work”:
Stephen Hawking makes the following observation in ‘A Brief History of Time’:
“[a scientific theory] is always provisional in the sense that it is only a hypothesis: you can never prove it. No matter how many times the results of experiments agree with some theory you can never be sure that the next time the results will support the theory. On the other hand you can disprove a theory by finding even a single observation that disagrees with the predictions of the theory.”
Science is science, and finance isn’t. In Finance World, simplistic models are used in crude simulations of the market, and the only way their creators can even attempt to keep a straight face is by bolting on ever more elaborate fixtures to the models to account for their all-too-obvious flaws.
There’s a (not particularly funny) joke about economics that’s relevant here.
A physicist, a chemist and an economist are washed ashore on a desert island.
Pretty soon, their supplies are exhausted and they’re on the verge of death.
Then, out of nowhere, a can of baked beans rolls ashore. But how to open it?
The physicist thinks for a second.
“With the right materials I can probably assemble some kind of solar array to burn through the lid,” he says. “Let me think…”
The chemist mulls over the problem.7
“I can probably make some kind of chemical reaction involving salt water and that way we can erode the lid,” he says.
Now it’s the economist’s turn.
“Let us first assume we have a can-opener…”
Building on the work of Harry Markowitz, the CAPM was the creation of Jack Treynor, William Sharpe, John Lintner and Jan Mossin. Sharpe, Markowitz and Merton Miller would go on to receive the 1990 Nobel Memorial Prize in Economics – always a dangerous sign – for their “contribution” to financial economics. Fischer Black and Myron Scholes would go on to develop the so-called Black-Scholes model for derivative pricing in 1973.
Bad economics. Overly crude modelling. Widespread adoption within the financial services industry. What could possibly go wrong?
Prior to the financial crisis of 2007/8, the finest example of academic vanity leading to disaster came in the form of Long Term Capital Management (LTCM), the hedge fund demolished by its own Nobel laureates. It is said that during a fund raising round in late 1993, a young trader at the insurance company Conseco bridled at the idea that LTCM could reap massive rewards from the (highly efficient) multi-trillion dollar US Treasury bond market. Future Nobel laureate and co-inventor of Black-Scholes, Myron Scholes, immediately responded:
“You’re the reason. Because of fools like you we can.”
LTCM would go on to lose billions, back when that was an incredible sum of money. Their losses were so severe, in fact, they were deemed ‘too big to fail’ and required a massive bailout.
LTCM was the dress rehearsal for the global financial crisis in two respects. First, because it showed how much money you could lose with enough Nobel laureate economists on your side. Second, because it effectively enforced the principle of “the Greenspan put” – the idea that, in extremis, the Fed, or any other central bank, would a) slash interest rates to help out Wall Street and b) do whatever else it took to bail out Wall Street. Taxpayers be damned.
Nearly three decades later, the Greenspan / Bernanke / Yellen / Powell put is starting to look a little long in the tooth.8
We can trace the failure of LTCM in 1998 right back to Markowitz and, for that matter, to Walras himself.
The market volatility experienced in stock, bond and currency markets in August 1998, for example, should, according to Finance World’s standard risk models, never have occurred.
On August 4 of that year, the Dow Jones Industrial Average fell by 3.5%.
Three weeks later, as the news out of Russia got worse, stocks fell by 4.4%.
On August 31, they fell by 6.8%.
Other asset classes fared worse – notably bonds. Bank bonds fell by a third in value relative to Treasuries. LTCM was on the wrong side of both trades (it was long credit and short government debt, in all markets, using leverage of 200:1. The adjective “foolish” springs to mind.)
Standard risk modelling theory had estimated the odds of that final, August 31 collapse at one in 20 million – something that, if you traded daily for almost 100,000 years, you would not expect to encounter once.
The odds of experiencing three such declines in the same month were even more minute – roughly one in 500 billion.
In the parlance of risk modelling and the normal distribution curve of standard deviation (the bell curve), August 1998 was a succession of “fat tails”.
Or was it?
A year beforehand, the Dow had fallen by 7.7% in a single day. Probability: one in 50 billion.
In July 2002, the Dow recorded three separate steep falls within seven trading sessions. Probability: one in four trillion.
On October 19, 1987, the Dow fell by 29.2%. Based on the standard financial theory, the probability of the October 1987 crash was less than one in 1050 – odds so small that they have no meaning whatsoever in reality.
The bell curve, shown below, and courtesy of the German mathematician Carl Friedrich Gauss – hence the phrase ‘Gaussian distribution’ – shows variation in probability distributions.
To make those somewhat arid numbers more relevant… Consider the adult male population in the USA. The average height of an American male adult is roughly 70 inches. The standard deviation from average height is two inches.
So 68% of all American men are between 68 and 72 inches tall (that is, they stand within one standard deviation either side of the mean).
95% of all American men are between 66 and 74 inches tall (within two standard deviations either side of the mean).
And so on.
The standard bell curve doesn’t “disprove” the existence of giants or dwarves – rather, it simply suggests that their populations are going to be very small. Which, in real life, is precisely the case.
But in the financial markets, the standard bell curve does not exist.
The bell curve is not a good map for those navigating financial market reality.
Between 1916 and 2003, for example, the daily index price movements of the Dow do not fit neatly on the bell curve. The ‘tails’ are too fat, i.e. the ends of the curve that are supposed to be very low probability events (like a 1 in 50 billion chance market crash) aren’t so low probability after all.
Based on the bell curve, there should have been 58 days when the Dow moved more than 3.4%. In fact, there were 1,001 of those events.
The bell curve predicts six days of index swings beyond 4.5%. In fact there were 366 of them.
Index price swings of more than 7% should, according to theory, come once every 300,000 years. In reality, the twentieth century saw 48 separate occasions of them.
Could standard financial theory be wrong?
Markowitz didn’t deserve his Nobel Memorial Prize in Economic Sciences. That award should have gone instead to the Polish-born scientist and mathematician Benoit Mandelbrot. But Mandelbrot died in 2010, so will sadly never get his chance.
Mandelbrot, father of the Mandelbrot set, of never-ending fractals, is co-author, alongside Richard Hudson, of a book entitled ‘The (mis)behaviour of markets’. This is, we would suggest, the perfect companion piece to Benjamin Graham’s ‘The Intelligent Investor’. Where Ben Graham addresses the art of investing, Mandelbrot addresses the science.
And Mandelbrot’s book is, to the best-selling author and financial theorist Nassim Nicholas Taleb: “The deepest and most realistic finance book ever published.”
If you happen to look at price records, as Mandelbrot did, especially in relation to the market in cotton, you find a different kind of distribution to that of the bell curve.
The tails in the market price curve do not flatten out into irrelevance. Rather, they follow a “power law” that happens to be quite common in nature.
In a “power law” relationship, a relative change in one quantity triggers a proportional relative change in another. If you double the length of a square, for example, its total area is multiplied not by two times, but by four.
The same type of “power law” holds for income distributions (the so-called Pareto principle, “the 80-20 rule”, shows that roughly 20% of the population accounts for 80% of its wealth). And it also holds, somewhat ominously for those who believe in stable or easily controllable markets, for earthquakes, volcanic eruptions, landslides, and forest fires.
Unlike Markowitz, who conjured up a square theory in blissful isolation and then hammered it into the round hole of the market, with little bits of relevance flying off the theory each time, Mandelbrot developed his own theories having already spent a good deal of time assessing historical prices.DECEMBER 2015 ISSUE F
Here are some of his conclusions.
Rule 1: Markets are riskier than we think. And certainly riskier than conventional financial theory thinks.
Price movements do not happily track the bell curve.
Extreme price swings are not the exception. They are the norm.
Which is one reason why ‘value’ investing carries extra appeal for us in today’s market environment. If we believe that market valuations have been badly distorted by monetary stimulus, it makes even more sense to concentrate on finding explicit “margins of safety”.
Rule 2: Trouble runs in streaks.
Or as Shakespeare put it: “When sorrows come, they come not single spies / But in battalions!”
Market turbulence does not arise out of a clear blue sky and then disappear. It tends to cluster. A wild market open may well be followed by an equally desperate full trading session. A wild Monday may well be followed by an even wilder Tuesday.
Rule 3: Markets have their own personality.
Ben Graham famously created the manic depressive character ‘Mr Market’ to account for the stock market’s oscillations between greed and fear.
But when individual investors, institutional fund managers, hedge funds, day traders and sovereign wealth funds come together in a real marketplace, a new kind of market personality emerges – both greater than, and different from, the sum of its constituent parts.
Mandelbrot suggests that market prices are determined by endogenous effects specific to the inner workings of those markets, rather than by exogenous, external events. For example, his analysis of cotton prices during the last century showed the same broad pattern of price variability when prices were unregulated as they did in the 1930s when cotton prices were regulated as part of FDR’s New Deal.
Rule 4: Markets mislead.
In Mandelbrot’s words: “Patterns are the fool’s gold of financial markets.”
The workings of random chance create patterns, and human beings are pattern recognition experts. We see patterns even where none exist.
This does not necessarily invalidate technical analysis – if enough market technicians believe that a certain price level equates to support, or resistance, that presumed support or resistance line will become a self-fulfilling prophecy. But Mandelbrot clearly advocates caution: financial markets are especially prone to statistical mirages. And bubbles and crashes are inherent to financial markets. “They are the inevitable consequence of the human need to find patterns in the patternless.”
Rule 5: Market time is relative.
Just as the market has its own personality, so it has its own time signature. Professional traders often speak of a “fast” market or a “slow” one, depending on their assessment of volatility at the time in question. And financial markets scale. Even the financial media scales: companies and media corporations issue annual reviews, quarterly results, monthly updates, daily newspapers and ad hoc electronic bulletins.
And in a “fast” market, things like market-, stop- or limit orders have limited utility. Prices don’t necessarily glide. Sometimes they gap down or leap up, effortlessly vaulting beyond price limits presumed to protect portfolios from ruin.
Without continued intervention by the world’s central banks, a deflationary crash may be inevitable. So how long will this intervention continue? We don’t know. And unless you’re a personal confidant of Jay Powell or Christine Lagarde, neither do you.
But there are practical steps we can all take to try to protect, preserve and grow our wealth.
We happen to believe that central banks, as Mario Draghi pledged back in July 2012, will continue to do “whatever it takes” to keep the financial system from the cliff ’s edge. Whether they succeed is another question. It might well be the case that in trying so hard to save the system, they end up accidentally destroying it. You cannot seriously study either economics or finance without becoming intimately familiar with the laws of unintended consequences.
We also happen to believe that there are realistically two, and only two, sustainable ways of creating and then exploiting “an edge” in the financial markets in pursuit of profit over the longer run. One is through price momentum (those trend-followers, again, who are just as happy to sell as they are to buy, provided the prevailing price trend is strong enough), and the other is throughIcompelling value – shares in high quality businesses with principled management and robust moats, but bought at a bargain price.
But properly compelling values in a world where central banks hold sway are increasingly difficult to come by. ‘Value’ is subjective, and contextual, and sits rather uneasily with the sort of monetary stimulus being ladled onto the markets. Ben Graham-style value opportunities sadly don’t grow on trees.
Right now, we see defensible value, and safe haven attributes, in precious metals and precious metals mining companies, complemented by systematic trend-following funds. But 60 /40 when both the 60 and the 40 aren’t working ? Desperate times call, at a minimum, for unorthodox investing.
………….
As you may know, we also manage bespoke investment portfolios for private clients internationally. We would be delighted to help you too. Because of the current heightened market volatility we are offering a completely free financial review, with no strings attached, to see if our value-oriented approach might benefit your portfolio – with no obligation at all:
Get your Free
financial review
…………
Tim Price is co-manager of the VT Price Value Portfolio and author of ‘Investing through the Looking Glass: a rational guide to irrational financial markets’. You can access a full archive of these weekly investment commentaries here. You can listen to our regular ‘State of the Markets’ podcasts, with Paul Rodriguez of ThinkTrading.com, here. Email us: info@pricevaluepartners.com.
Price Value Partners manage investment portfolios for private clients. We also manage the VT Price Value Portfolio, an unconstrained global fund investing in Benjamin Graham-style value stocks and also in systematic trend-following funds.
Take a closer look
Take a look at the data of our investments and see what makes us different.
LOOK CLOSERSubscribe
Sign up for the latest news on investments and market insights.
KEEP IN TOUCHContact us
In order to find out more about PVP please get in touch with our team.
CONTACT USTim Price